
Customize your map
To access this feature, you must be a Facilitator.
GroupMap allows you to choose, design, and change map titles, descriptions, colors, icons, images, and charts.
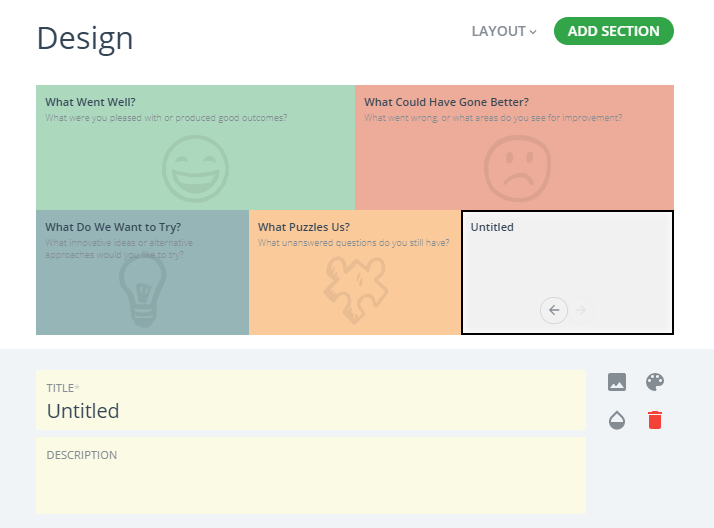
To design a map:
- Open the map customization page (see Customise your map).
- Click DESIGN. Click the area of the map to be changed.
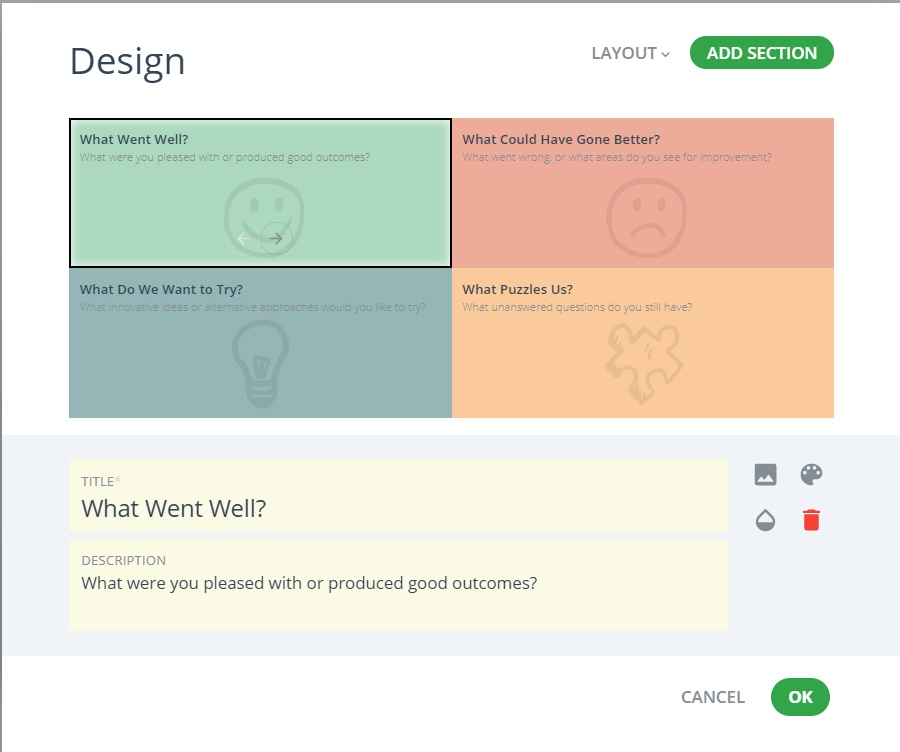
Select a map Category you wish to change, click on COLOR and select your preferred color, then click OK.


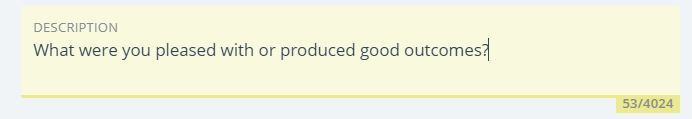
Changing Descriptions of your map Category
Select a map Category you wish to change, then click on the Description cell and type your description of the map Category, then click OK.
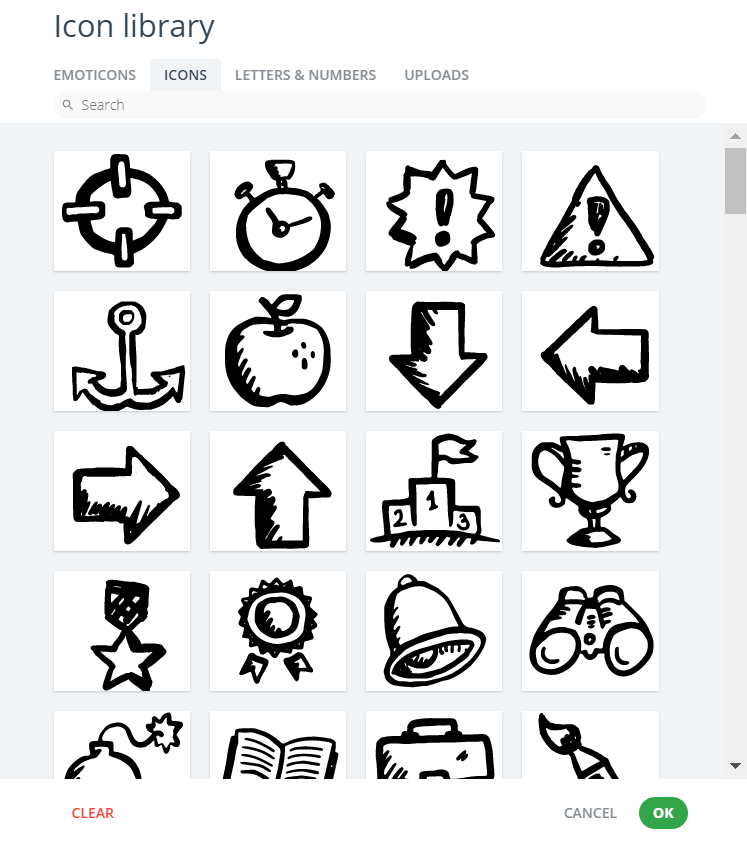
Changing Icons in your map / Uploading Icons for your map
Select a map Category you wish to change, then click on the Icon, located on the bottom left-hand side and select your preferred icon of the map Category, then click OK.
If you want to upload your own icons, we recommend using a Vector image such as an SVG file to avoid distortions as different browser mechanisms tend to distort other formats.
In general
- Raster images (like PNG) are scaled to fit (no fixed aspect ratio)
- Vector images (like SVG) are resized preserving the image aspect ratio.

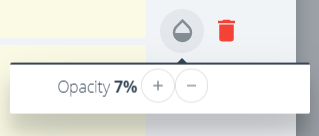
Changing image opacity
Select the image that you want, then select IMAGE OPACITY and increase the percentage to make it more visible and vice versa.

Changing map layout
Click LAYOUT and select the most suitable design.

For example, you can use columns instead of quadrants.

Add/Delete section(s)
To add a new section, click ADD SECTION.

To delete a section, select it and click DELETE SECTION, then click REMOVE.

- Select the AXIS tab.
- Select the AXIS Style.
- Change the name of the X and Y Axis in the yellow cells, then click OK.

Changing the Chart REGION Titles and Descriptions
Click on your map and complete the following steps:
- Select the REGION tab.
- Enter a new Title and Description for each of the Regions, then click OK.

Change the COLOR of the Chart Region
- Select the BACKGROUND tab
- Select the color you wish to have for the Region, then click OK.
